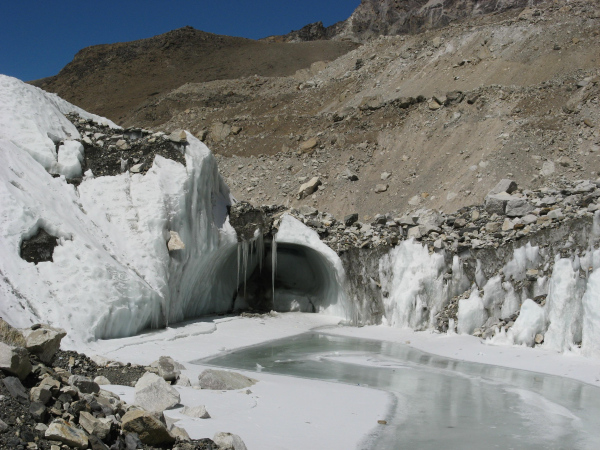

Glaciers are repositories of information for climate change studies as they are sensitive to changes in temperature, precipitation, and at-surface solar radiation. Due to increased melting, shrinking, and retreat of glaciers in recent decades, the number of glaciers has increased and the area has decreased in the Himalayas. The application showcases changes in the glaciers in Bhutan from 1980, 1990, 2000, and 2010. The interactive glacier maps were prepared for four decades using a uniform data set and methodology, which provide a scientific basis for understanding the changes taking place in the glacial environment in the Himalayas of Bhutan.
Glacier data are derived from LandSat MSS, LandSat TM and LandSat ETM+ images using object based semi-automatic feature extraction. Additional attributes such as glacier area, estimated ice reserve, slope, elevation, and aspect are also derived for each glacier.
The statistics on glaciers can be viewed for the whole country or at disaggregated basin and sub-basin levels.
The distribution of glaciers according to ice reserve and glacier area, elevation range, and hypsograph are presented as charts and tables through an interactive interface.
Tables with detailed information are provided for individual glaciers with corresponding charts. A time slider tool is provided to visualize decadal changes of each glacier.